Viewing Image Data#
xrd-image-util’s ImageDataGUI provides an lightweight, interactive way for users to visualize 3D image data.
Accessing the ImageDataGUI#
Depending on the use case, there are multiple ways to access the GUI:
Scans
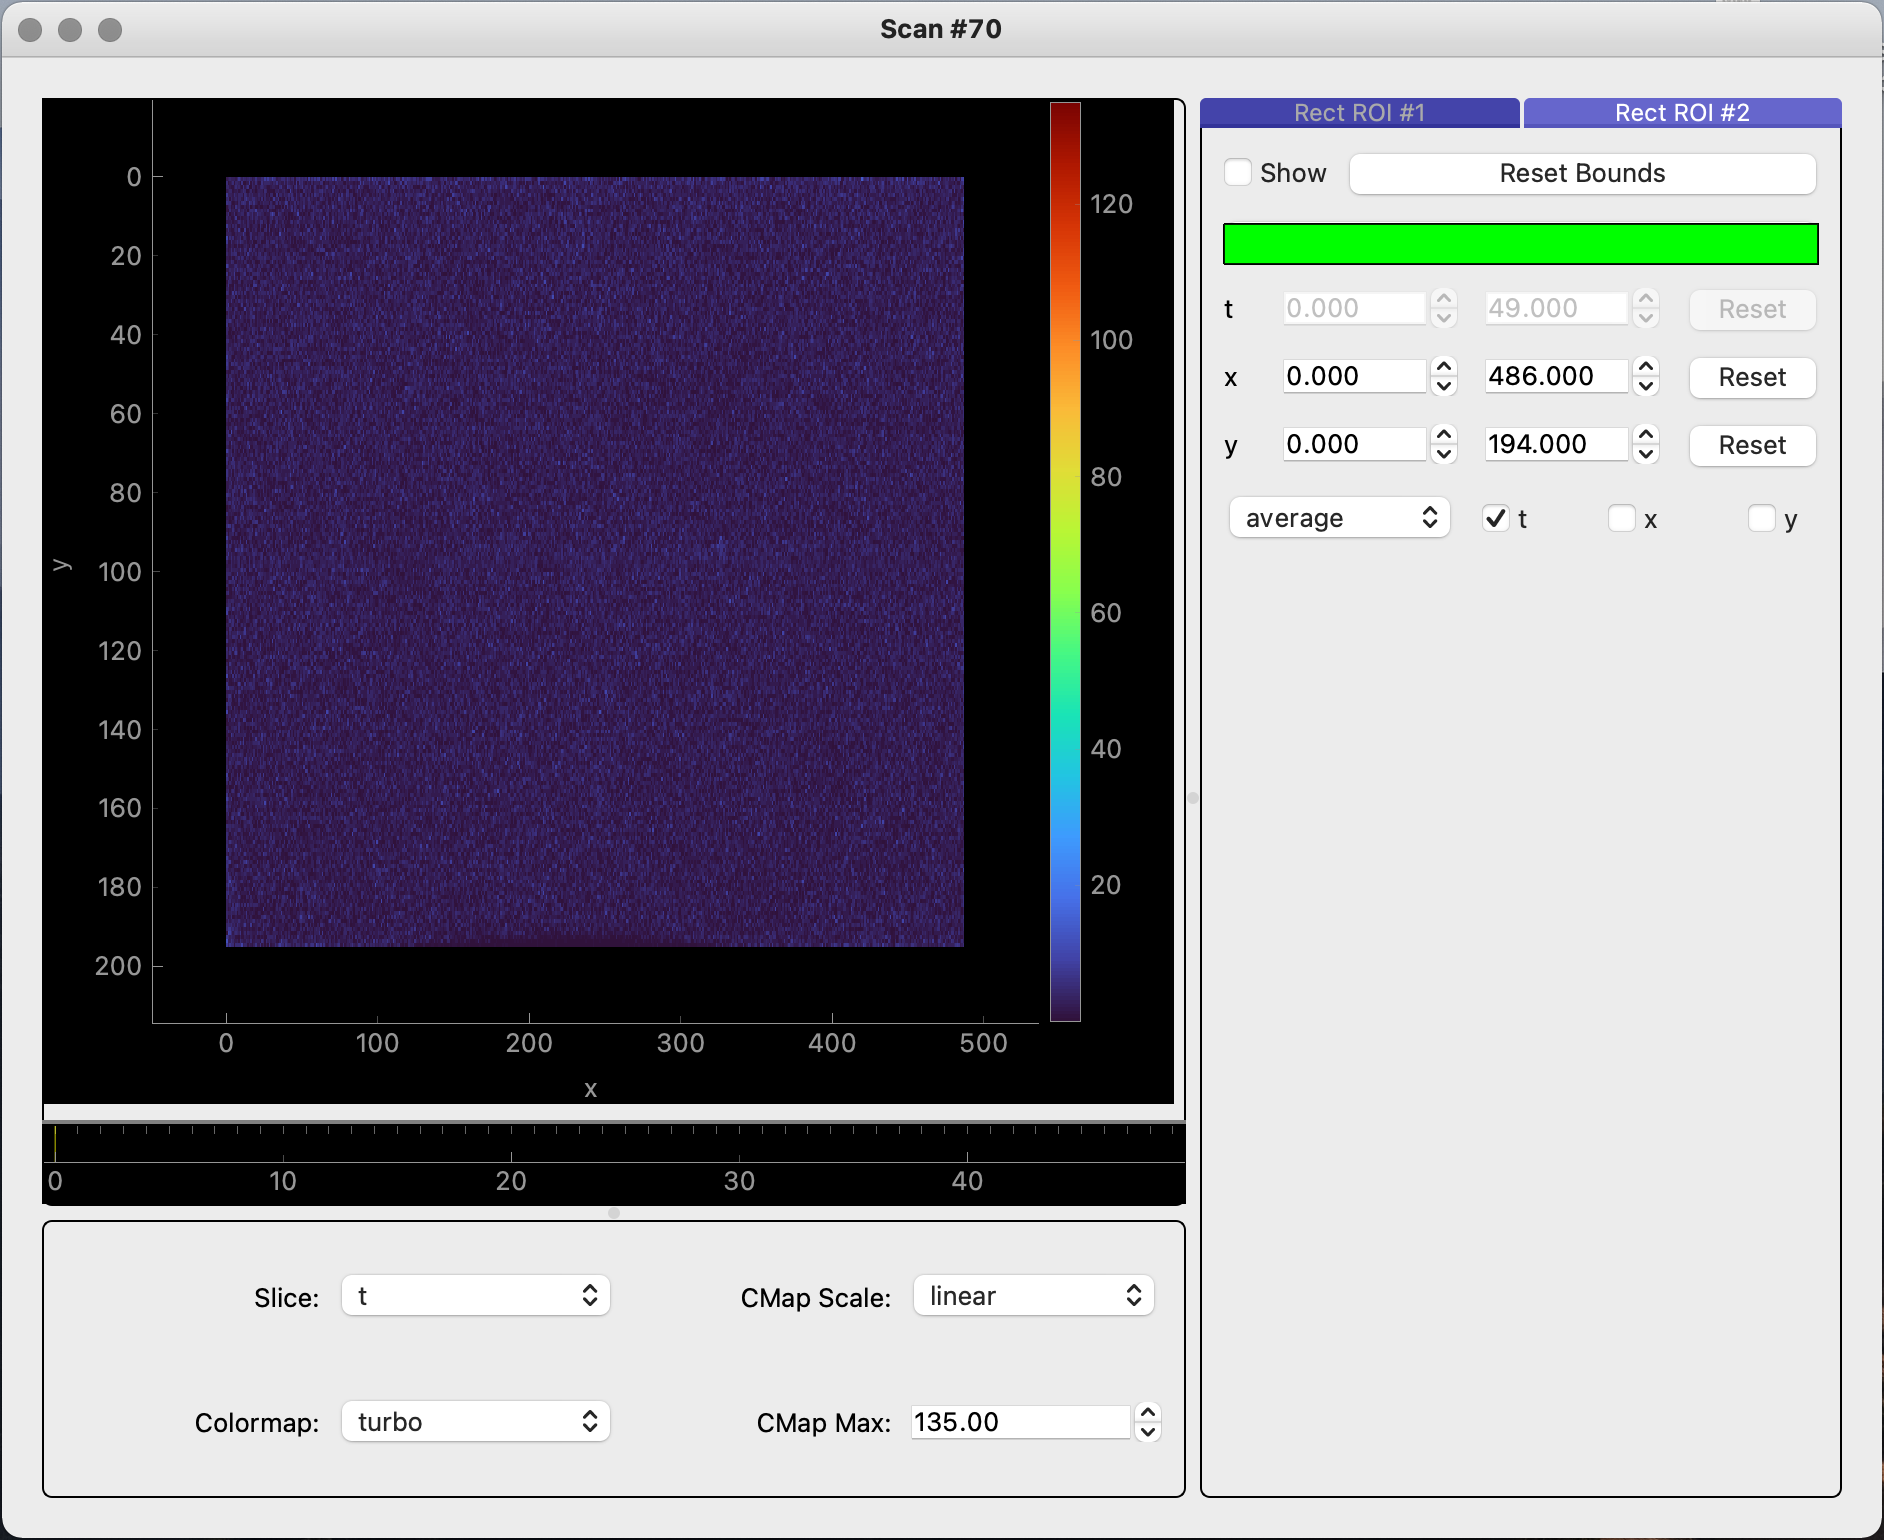
The raw data for a
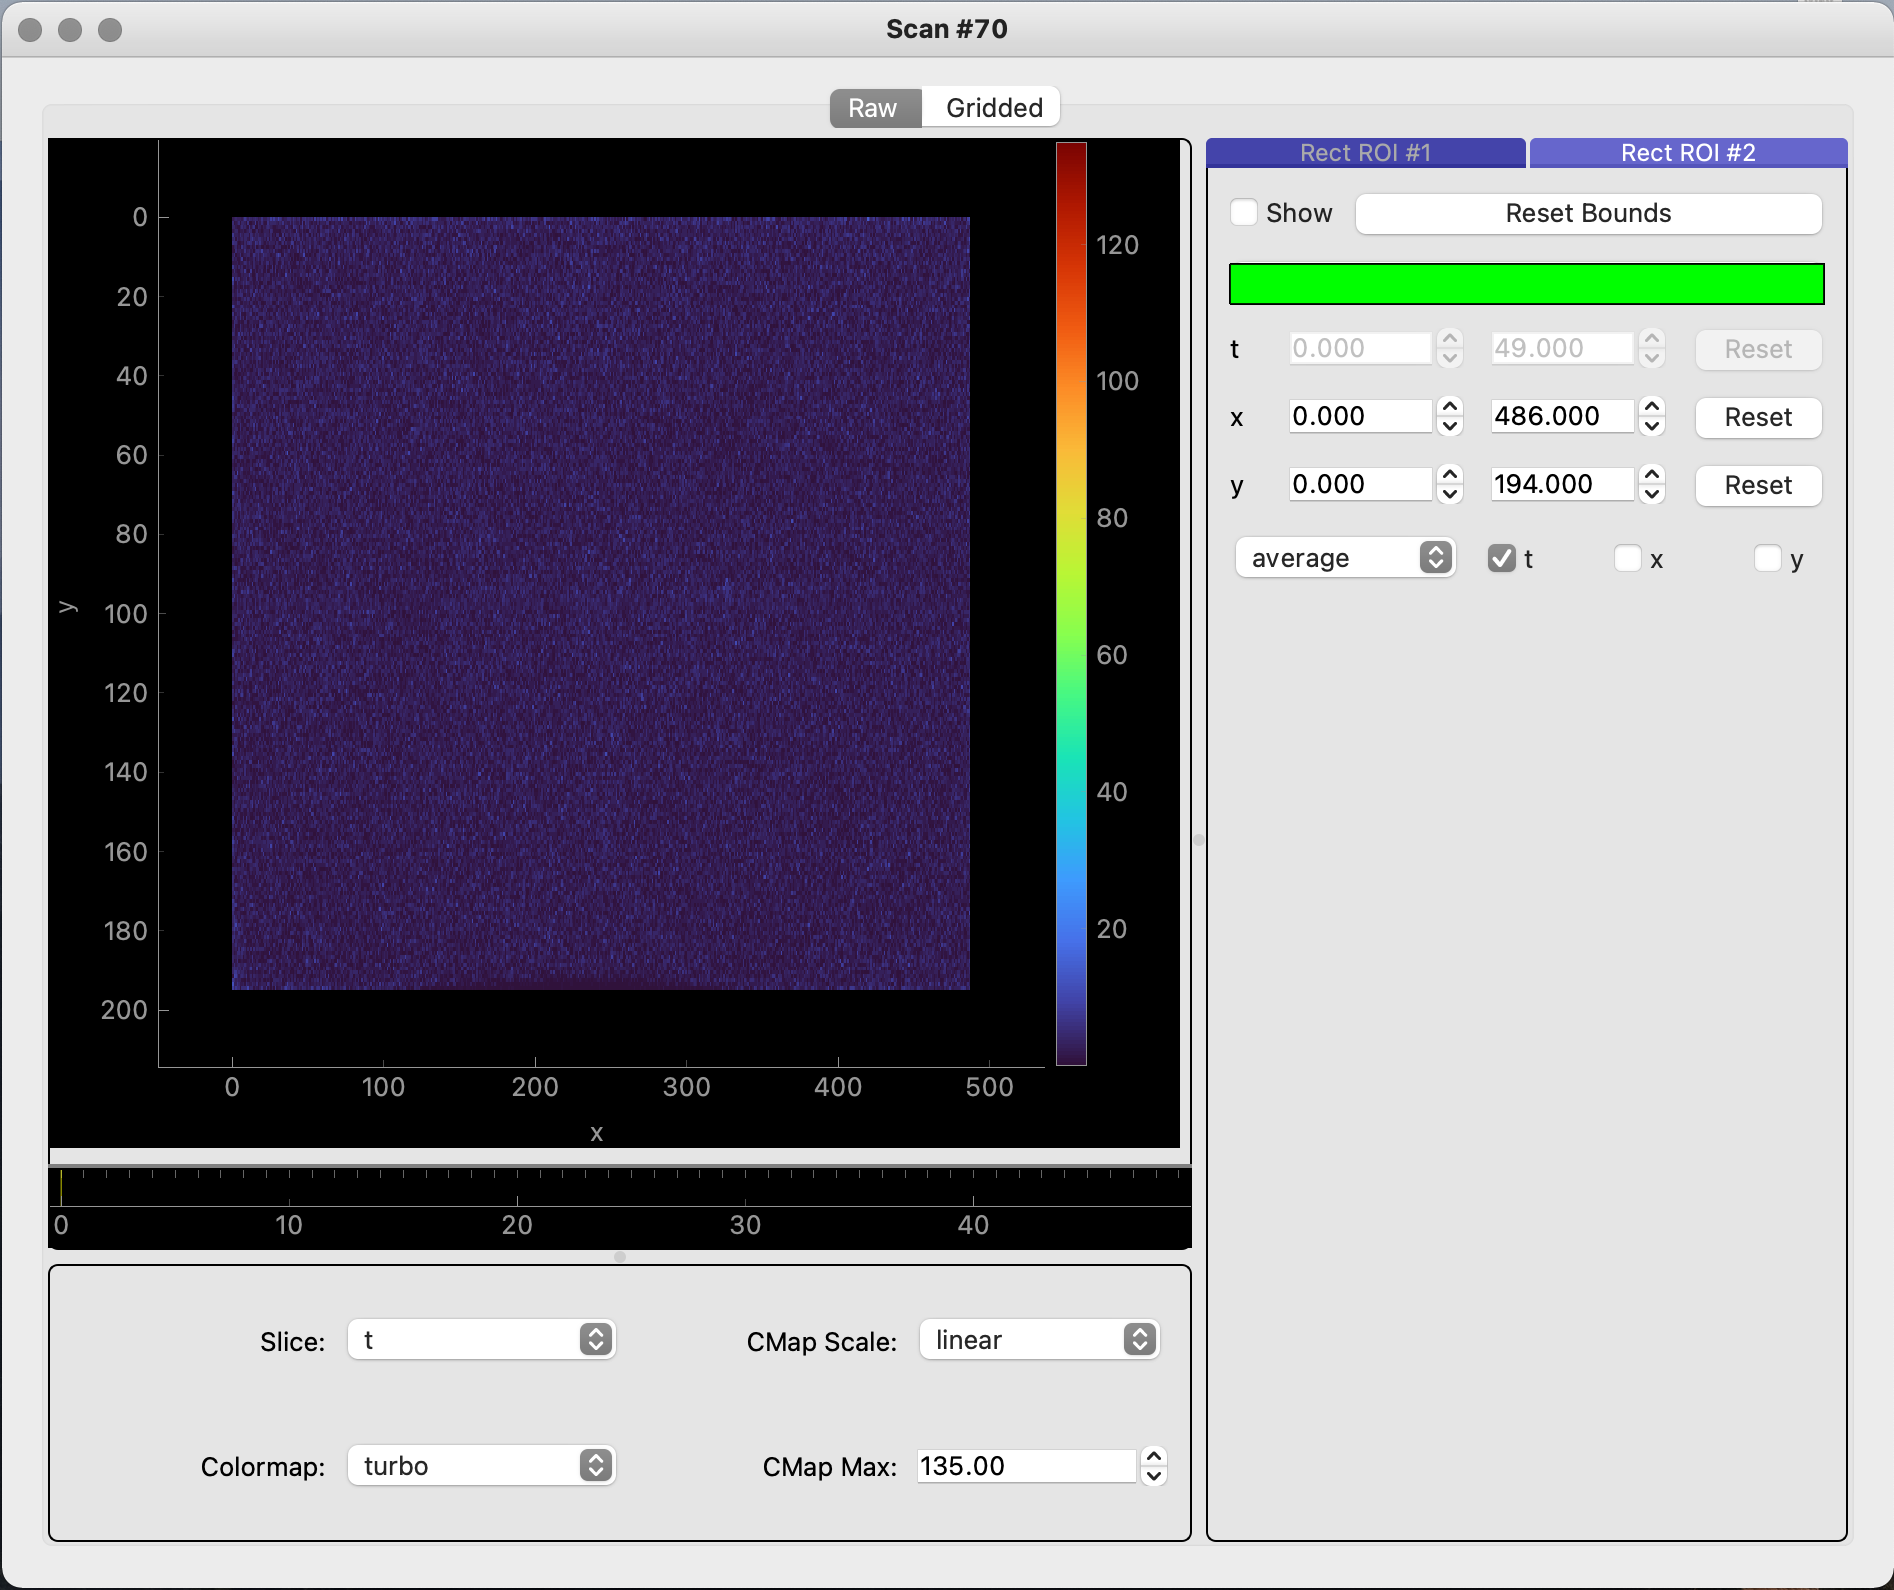
Scanobject can be visualized by simply calling theScan.view_image_datafunction. To view a scan’s gridded reciprocal space mapped image, you must ensure that theScanobject’s gridded data has been set up with theScan.grid_datafunction. After gridding the data, theScan.view_image_datafunction will reveal a GUI with two separate tabs: “Raw” and “Gridded”.# Displays raw image data only scan_70.view_image_data()
# Displays raw and gridded image data
scan_70.grid_data((200, 200, 200))
scan_70.view_image_data()
General 3D Numpy data
The
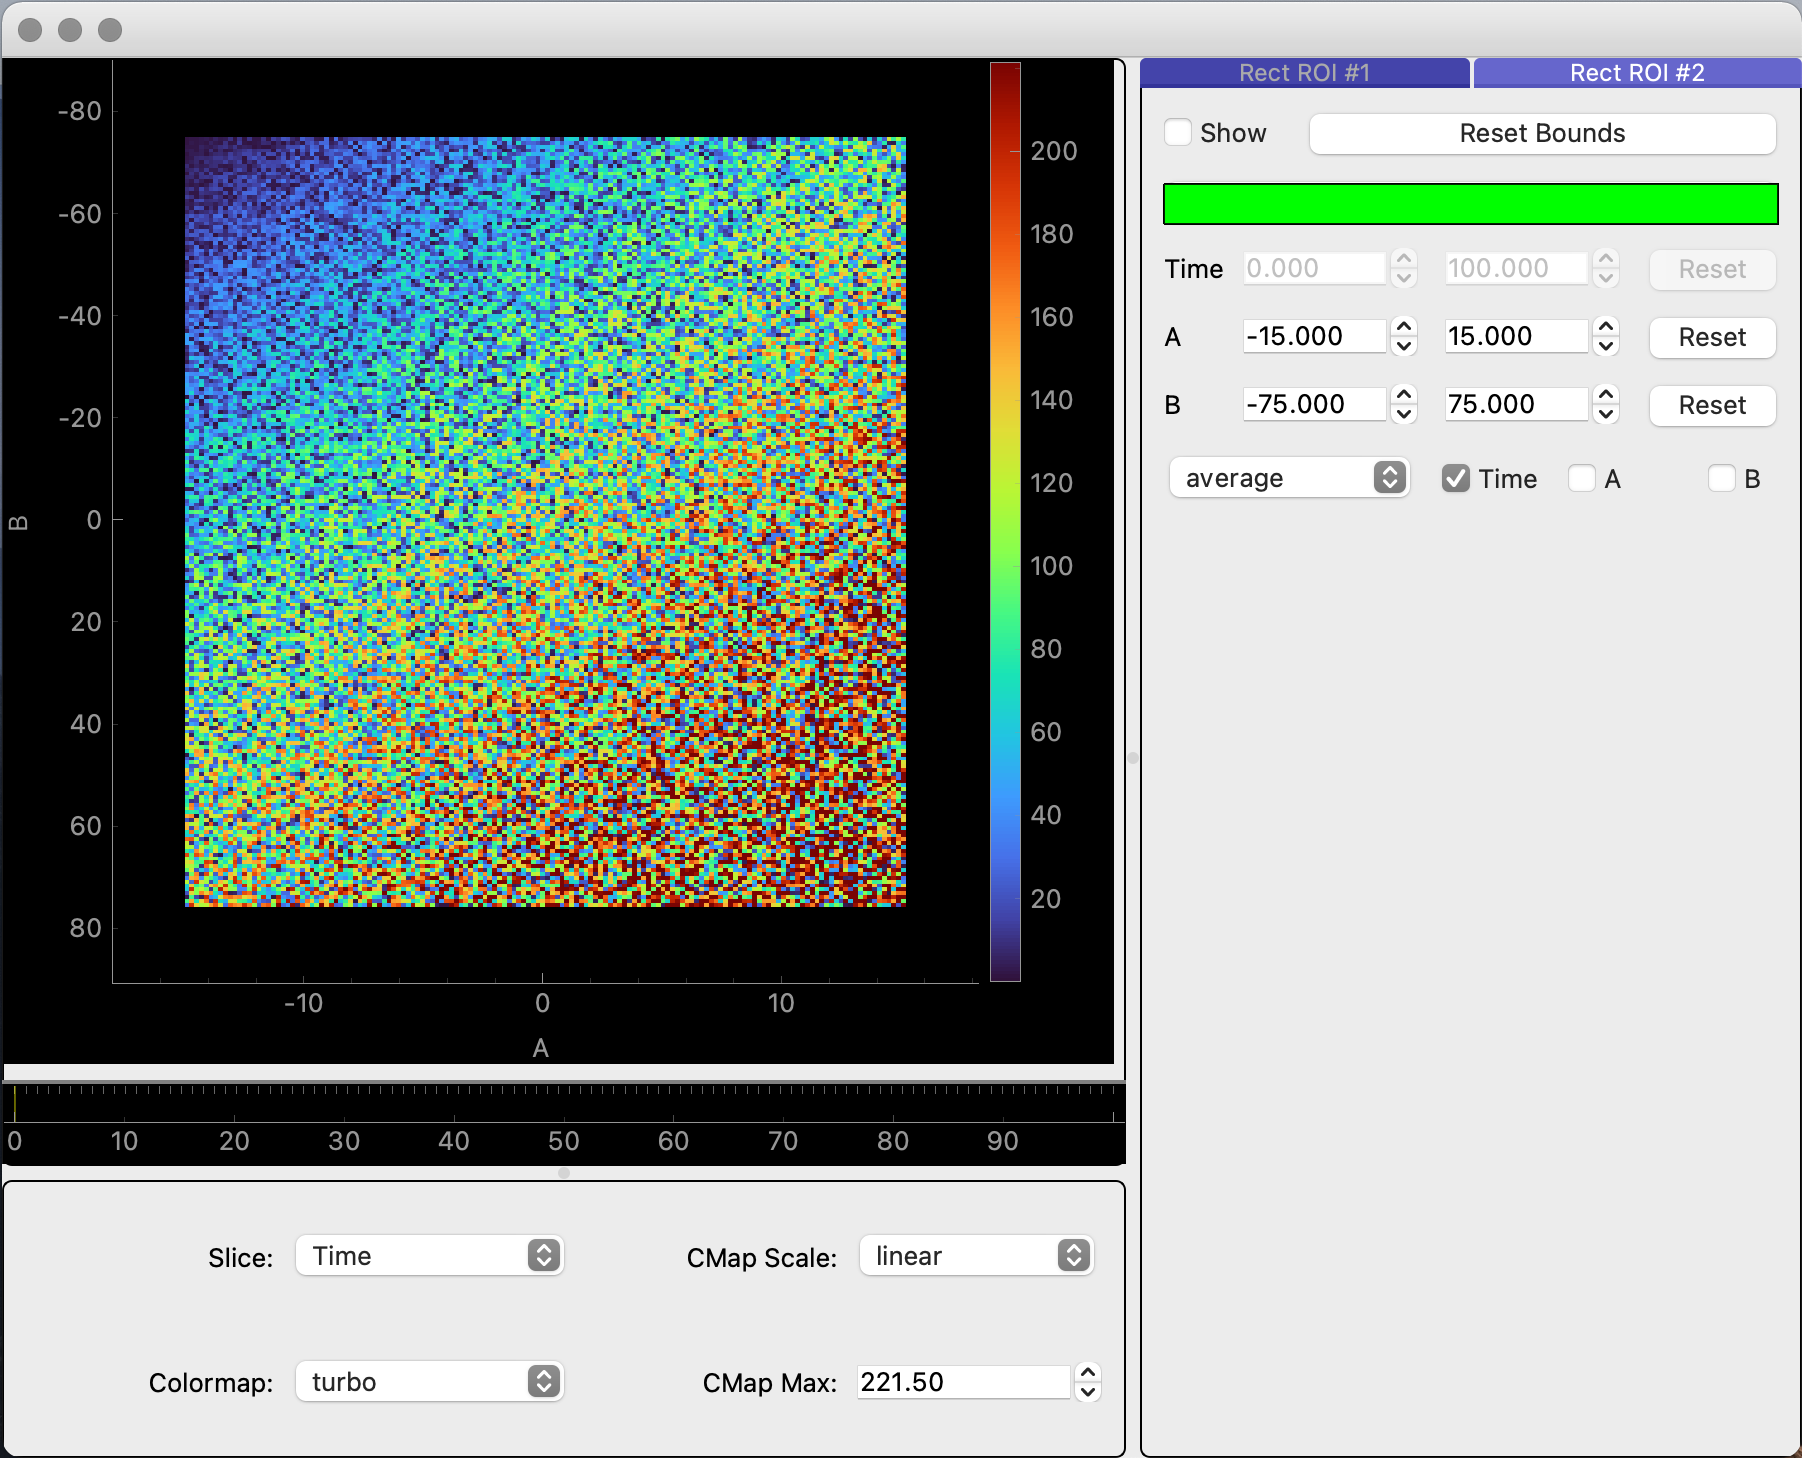
ImageDataGUIalso works with generalized data using thexiu.gui.view_image_datafunction. With this function, a user can provide a 3D numpy array and, as an option, a dictionary of labels and linear coordinates for each dimension.import numpy as np # Generating a 3D array of data data_shape = (100, 150, 200) data = np.zeros(shape=data_shape) for i in range(data_shape[0]): for j in range(data_shape[1]): for k in range(data_shape[2]): data[i, j, k] = np.random.randint(i + 1, i + j + k + 2) # Displaying the GUI xiu.gui.view_image_data(data)

import numpy as np

# Generating a 3D array of data
data_shape = (100, 150, 200)
data = np.zeros(shape=data_shape)

for i in range(data_shape[0]):
    for j in range(data_shape[1]):
        for k in range(data_shape[2]):
            data[i, j, k] = np.random.randint(i + 1, i + j + k + 2)

# Defining linear coordinates for each dimension
coords = {
    "Time": np.linspace(0, 100, 100),
    "A": np.linspace(-15, 15, 150),
    "B": np.linspace(-75, 75, 200)
}

# Displaying the GUI
xiu.gui.view_image_data(data, coords)